I hate writing an ideological blog post for many reasons. Foremost I believe that research and information is easily dismissed when it is attached to an ideology. Secondly, I think it’s possible to learn a great deal about the world without resorting to an ideological framework, so why not avoid it? This blog forgoes some of this belief in the hopes of raising some clarity on one of the biggest issues in US politics right now: US public debt.
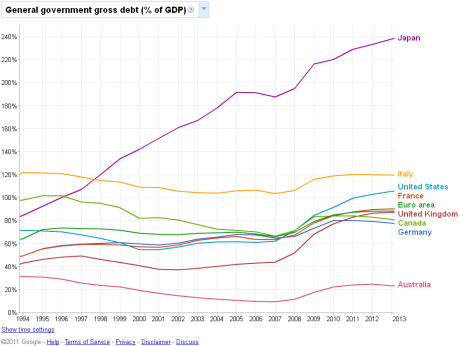
Partially born from the Tea Party movement, but also from earlier advocates of debt reduction, there is now wide concern over the dangers of our public debt. There’s even this website that shows US debt figures by the second and subsequently crashes your browser. There is legitimate cause for concern, as the Eurozone has witnessed astonishing upheaval over some of its members’ sovereign debt. The US borrows a lot of money, with its current gross debt at around $14 trillion. But while groups have painted the US debt as a leviathan that presents an existential threat, I feel this is hyperbole. Yes, the US borrows a staggering amount of debt to finance its government, but it also produces an enormous amount of money. The US has a GDP of about $14.6 trillion; it’s easily the largest economy in either Purchasing Power Parity or Nominal enumerations, making its debt more serviceable than Greece’s because it owes a smaller amount of money than it produces annually. When comparing gross public debt to GDP instead of gross debt in absolute terms, the US debt looks considerably less out of control:
This graph was taken from Google Public Data Explorer, and can be accessed here. The data comes from the IMF, and shows US debt ballooning in recent years, though its still considerably lower than Greece’s debt or Japan in particular. This doesn’t mean the US would be fine was its debt to reach Japanese levels. But it begs the question: why are we so concerned about government spending if we could simply outgrow our debt?
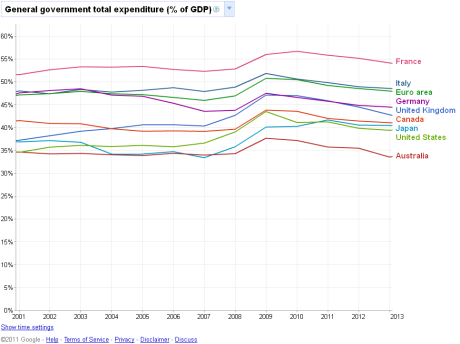
Critics of the debt policy we currently have argue that the government has become massive and spends enormous amounts of money inefficiently. We do spend trillions of dollars on our government, but again we produce trillions more in income every year.
Again this graph is from Google Public Data Explorer and can be found here. I used data from 2001 onwards because the US didn’t have figures for government spending before then. We see from this graph that our government actually spends some of the least compared with other developed countries. Only Australia spends less as a percentage of GDP compared to the US. France spends over 54% of its GDP on government compared with the US’s 41%. The US falls well below the Eurozone average of 49%. So in perspective, our government isn’t a leviathan unless you only look at spending in absolute terms.
Why did we get here? It has been argued that Obama ushered in a new era of government spending. Spending as a percent of GDP did in fact grow in 2009, though it should be noted that TARP and the early Stimulus package contributed largely to these figures. Also important to note is that while these two bills consumed trillions of dollars in bailouts and stimulus monies, they were both passed while the US was in a recession. This means that the US economy was shrinking while these spending increases were taking place. US economic growth has been feeble in recent times, and because of this US receipts from taxes and other sources have been lower than before the recession.
This brings up an important point, taxes and spending aren’t just related to US debt, they are the determinants of it. When Bush cut taxes in his term, he lowered the amount of money the government could use to pay for services, creating a deficit. Before this, the US actually ran on a budget surplus for several years of the Clinton administration. One reason was that taxes were a little bit higher than they are now. During the Bush administration US taxes were low, compared to the rest of the OECD (a rich country organization):
I found this graph from wikipedia which nicely shows US debt and its growth through several administrations:
This graph is self-explanatory. Obama’s administration has seen the debt increase, but so did Reagan’s government, and both Bush administrations. Debt to GDP actually shrank under every Democrat elected president after WWII.
The New York Times has a compelling interactive article that graphs the debt crisis.
Taken from the article is:
This graph shows many things, but I think two are most important: First, Obama has done much to increase the public debt of the US, but the Bush administration did much more over his 8 year term. Second, while China owns the largest amount of US debt of any foreign country, they only owe slightly more than US ally Japan, and three times as much debt is owed to individuals, local governments, or corporations within the United States than is owed to China.
Another compelling infographic comes from the same article courtesy of the New York Times:
This graph shows something I wanted to briefly talk about last. Ratings agencies like Moody’s and Standard and Poor are used by investors (or any buyer of sovereign debt) to estimate how likely a country is to repay its debt. The US has enjoyed the highest possible rating for several decades now. Moody’s and Standard and Poor both recently changed the outlook on US debt from Stable to “Watch Negative.” S&P explained, they view any failure to raise the debt limit as a threat to US credit worthiness, and did so not because of the size of US debt, but because of the danger of the US failing to repay its debts in the short term.
Finally, yields (interest paid by a debtor country to its creditors) on US bonds is still at a healthy 3.0%, not as low as Switzerland or Germany’s but still stable. Bond markets can be subject to bizarre movements, as Japan has seen its yields drop the lowest rate of any sovereign debt, despite having the highest debt to GDP ratio of any country and despite having a lower credit rating than the US. At the same time, most buyers of treasury bonds have little choice but to continue to buy US debt. As a different NYT article points out:
“There are limits to cutting back because other large bond markets, in Europe and Japan, are not nearly as liquid. “As long as the dollar remains the dominant currency there’s little choice for many in the public sector but to hold U.S. debt,” said the senior European policy maker. ”
While public debt is certainly a medium-term and long term concern, it makes little sense for us to risk default or make painful cuts to entitlement programs when put into perspective, our public debt is hardly as worrying as US unemployment or weak consumer spending currently is.


