Hi again, it’s been too long. I’m starting to make a habit of apologizing at the start of each new blog; I think instead of doing that I will just try to update this more often. While you may not have enjoyed my 3,000 word wall text about the New Year last time, you’re sure to enjoy this blog about government debt! And while this blog is very similar to some other posts I’ve written in the past, I think it addresses some important newer information. In a way I will be piling onto an issue and a paper (more specifically) that has already gotten much attention. The Reinhart-Rogoff research paper has been refuted for its macroeconomic theory by Nobel-winning economists and for it’s specific (excel-related) errors by grad students, even Stephen Colbert piled it on eventually. While opinions on the paper vary, no one can dispute it’s significance in framing the debate for policymakers from across the world. Others have already thoroughly refuted the paper’s conclusion, so I won’t try to do this directly. Instead, I would like to look into some of the broader questions that are raised in this paper; specifically, what is the relationship between government indebtedness and the overall health of the economy.
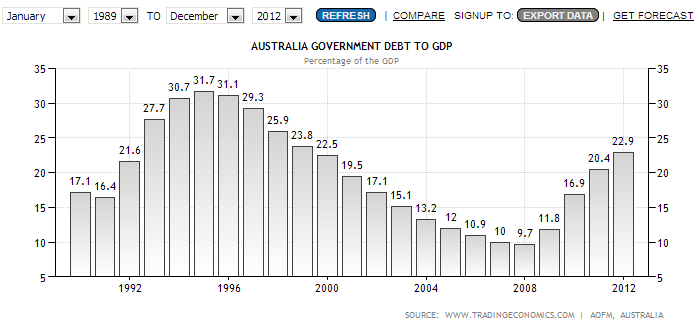
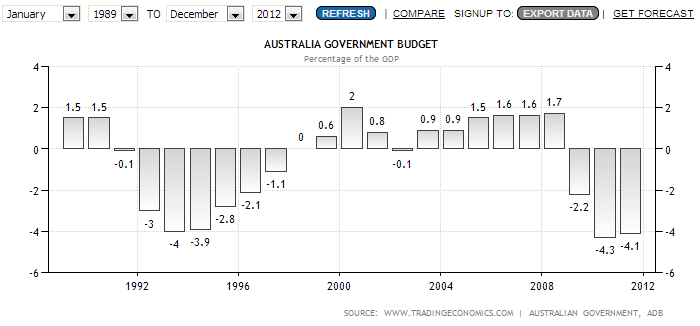
To begin, I want to briefly explain the paper’s thesis and how it’s been refuted. In 2010, Carmen Reinhart and Kenneth Rogoff of Harvard authored a paper titled “Growth in a Time of Debt” that argued that after a certain threshold of indebtedness (90% of GDP) a nation’s growth will drop off dramatically. Underlying this claim was a statistic stating that average GDP growth in developed countries with 90% public debt to GDP will see GDP growth of -0.1% on average. The pair refused to release their data to others until a grad student at the University of Massachusetts, Thomas Herndon, was allowed to use it for a term project where he intended to replicate their findings. Instead, he found that their excel spreadsheet had somehow omitted the results of five countries and incorrectly averaged New Zealand’s GDP growth. When those countries are taken into account, particularly Australia (!), Belgium, Canada, and New Zealand, Thomas found that average growth for countries with 90% debt to GDP was actually 2.2%, a very different result than -0.1%! Now, instead of chest thumping this news that broadly confirms my own interpretation of recent history, I’d like to dig deeper into the broader question raised by the Reinhart-Rogoff paper: what effect does high government debt have on the economy?
Before touching on any further numbers I’d like to briefly explain some terms I’ve used to get at the heart of what is being debated. GDP (Gross Domestic Product) is a nation’s total economic output (consumption+investment+government spending+exports-imports); this is the most common measurement of the size of a nation’s economy. Measuring government debt to GDP then is a way of comparing the size of a nation’s debt versus it’s entire economy. Economists prefer this measure over total debt amounts because it helps express the relative size of a country’s debt. With that said, here are two modern examples of the metric Reinhart and Rogoff explored and their divergent conclusions:


Both Japan and Spain have received a lot of media coverage lately for their economic circumstances, specifically their indebtedness. But as you can see in the graphs above, their levels of indebtedness do not correlate to growth with any consistency. Japan’s level of debt has remained above 100% of GDP since 1998, it’s economy has grown at an average rate of 0.55% annually. While that number looks quite weak (it is), it occurred during: the 1997-8 Asian Financial Crisis, the 2007-8 Global Financial Crisis, and the 2011 Tohoku Earthquake and Tsunami. Even with all of these headwinds the Bank of Japan predicts annual growth to be 2.9% in 2013. While Spain’s pre-crisis growth was higher than Japan’s, its much lower levels of indebtedness have not shielded it from the stagnation being felt throughout much of the Eurozone today. To further illustrate this, lets take a look at another useful economic indicator: unemployment rates and levels of indebtedness.


As you can see, despite relatively low growth and high levels of government debt, Japan’s unemployment is considerably lower than Spain’s astonishing rate; one in four Spaniards were unemployed in 2012 (currently it stands at 27.2%). If you’re thinking, “hey, Spain is very different from Japan, there’s more to the story than this” then you’re on to something. The problem with Reinhart and Rogoff’s conclusion (aside from its Excel errors) is that its simplicity obscures larger questions about debt and the economy: there’s more to it than “big debt bad, small debt good.” I want to explore what other factors are at play between public debt and the economy in the remainder of this post. There are several areas of concern that economists look at when it comes to public debt, many of these ultimately derive from one issue: borrowing costs. The short answer to why Spain has relatively little debt yet still faces economic headwinds is because it has had to borrow money at high costs in recent years. This cost is measured by the yield that is paid by Spain to buyers of its government bonds, like an interest rate (%) paid on a private loan. While Spain has seen its borrowing costs improve this year, it faced years of high yielding bonds before: 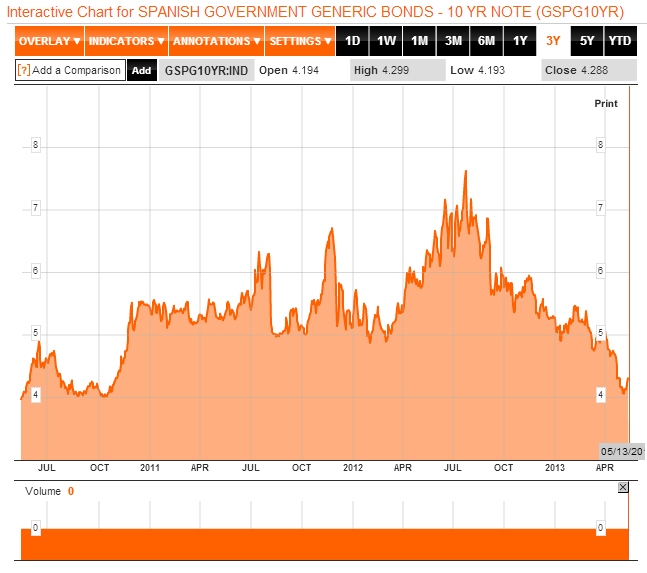
Years of high borrowing costs have done more than just complicate the finances of Spain’s government, it has found its way into the real economy as well. Spain is an example of what can happen when a country’s debt is not denominated in a currency that is controlled by the debtor nation’s central bank. Under normal circumstances (i.e. when a country borrows in a currency it also issues) a central bank has flexibility when it comes to both controlling a nation’s borrowing costs and shielding the economy from its harmful effects. For example, the central bank for the UK (the Bank of England) has used its power to both lower the yield on long-term government bonds (by purchasing them with printed money) and lowering interest rates (0.5% since 2009) to try and boost available credit in the real economy. In addition to these tools, central banks like the Bank of England have also intervened at times to lower their currency’s exchange rates with other countries. Without these options, Spain has instead had to rely on the policies of the central bank for the Euro, the ECB, with limited success.
The ECB dropped interest rates to 0.50% earlier this month (from a previous 0.75%) yet these rates have not translated into lower borrowing costs in Spain (among other countries). Instead, banks in Spain and other “peripheral” Eurozone countries like Italy and Portugal have had to pay more, in line with their government’s own higher borrowing costs. This, in turn, has translated into higher borrowing costs for Spanish and Italian businesses and decreased business lending overall: 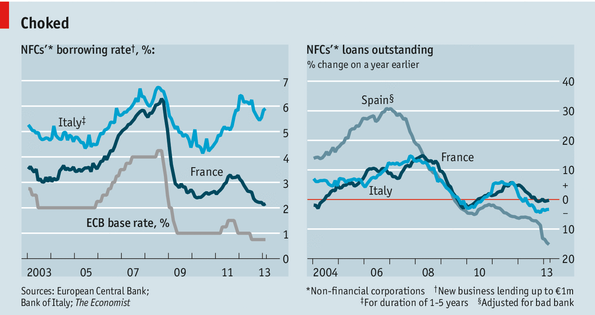
(Source: The Economist)
As you can see on the above graph, borrowing costs for Spanish and Italian businesses and the overall lending environment have fallen out of sync with ECB lending rates. The message I want to convey here is not that Spain’s economy is doomed to failure; Spain’s circumstance has actually improved somewhat recently. Instead I want to point out Spain’s high borrowing costs had nothing to do it’s government’s debt levels or deficits; before the Global Financial Crisis, Spain ran a budgetary surplus and had relatively little debt. So why has Spain been punished with high borrowing costs while countries with much larger debts (Japan and the US, for example) have not? The answer, as well as a new set of problems, come with control over the currency that debt is denominated in.
Something that astonished me when I first wrote about debt in the US two years ago was how low Japan’s borrowing costs are compared to its high debt:
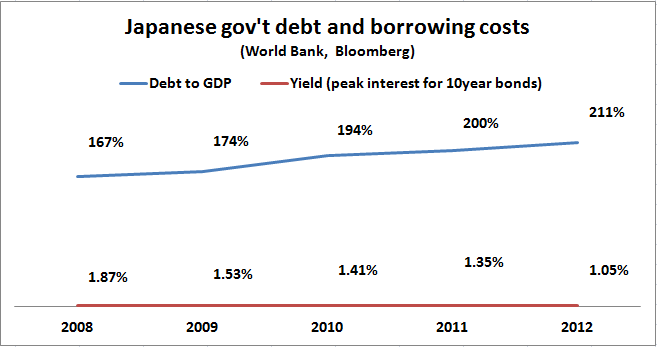

Despite it’s astronomical levels of debt, Japan has been able to borrow at remarkably low rates in recent years, much lower than Spain even in 2008, years before Greece would seek a bailout. Even when you compare Japan to other countries that issue debt in their own currency their rates seem quite low. Fortunately, there are very smart people who write about these things who have explained the situation for us. Essentially, through a mixture of Financial Repression by the Ministry of Finance and a willingness by Japanese households to put their savings into government bonds, rates have been kept quite low. But all is not well in Japan with this arrangement, as Noah Smith points out:
… it seems to me that the Japanese government’s success in holding down its borrowing costs has probably had big negative effects on the economy. Banks that are forced to buy JGBs can’t lend as much to firms, which seems like it would depresses economic activity, holds down growth, and probably contribute to deflation via suppressed wages. Households have been squeezed and squeezed by falling incomes until their savings rates have gone negative, yet they are still earning nothing on their savings.
In most countries we don’t think of deflation as a problem, but it can be just as damaging to an economy as inflation. Deflation, which Japan has experienced for most of the past decade, makes private borrowing more expensive, and pushes down consumption and investment over time. This has become a big enough problem that Shinzo Abe has implemented aggressive monetary and fiscal policies that are designed to increase inflation and decrease the value of the Yen, with mostly positive results so far. But Japan is unique in this regard: many countries fear the opposite when regarding inflation at a time of high debt.
(source)
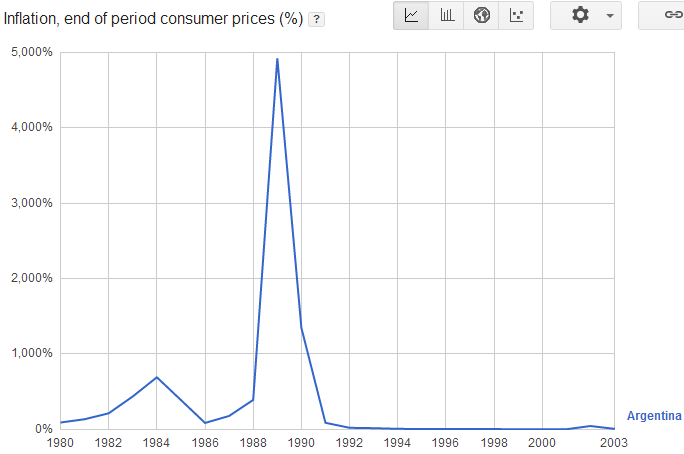
Argentina is a useful example of both the benefits and the pitfalls that come with controlling your own currency. From the 1970s to the early 1990s, Argentina suffered a series of currency shocks and generally high inflation, culminating in a spectacular 5000% annual inflation rate in 1989 (pictured above). That crisis was sufficient enough that Argentina began a currency peg with the US Dollar in 1991; under the new regime, anyone could exchange one Argentine Peso for one US Dollar. To maintain this “convertibility”, the central bank of Argentina had to maintain an equal amount of US Dollars in reserve as there were Pesos in circulation. While this had the positive effect of limiting inflation and increasing foreign investment in Argentina, it had many negative effects as well.
By tying the value of the Peso to the USD, Argentina effectively ceded its monetary policy to the US Federal Reserve. In addition to receiving the low inflation of the US Dollar, Argentina experienced the pitfalls of its high value: for the duration of the currency peg (1991-2001) Argentina’s current account (net trade and net investment) was negative. Unemployment started to increase as the currency’s high cost made difficult for businesses to pay living wages while remaining internationally competitive. By 1999, the unemployment rate reached 16% and the economy entered a three-year recession as Pesos and Dollars became scarce. At the same time, the government faced pressure from the IMF to lower its deficit with spending cuts, which it implemented to the detriment of the economy (sound familiar?). Argentina was forced to borrow at high interest rates before being shut out of bond markets entirely. With debt levels reaching 164% of GDP in 2002, the country defaulted on most of its debt and abandoned the currency peg shortly after. By devaluing its currency and effectively ignoring calls by the IMF for further austerity, Argentina was able to recover from the crisis with average growth above 8% since then. The downside to this recovery has ironically and not entirely unsurprisingly been a return to higher inflation levels.
Perhaps out of fear of the panic and political upheaval that precipitated the economic crises in 1989 and 2000, the Argentinian government has consistently underestimated official levels of inflation since 2007. This is best demonstrated by the average change of prices found online, which has been aggregated by groups like PriceStats; this index shows inflation for 2012 to be ~10% higher than the official figure of 13%. Inflation has become such a hot button issue there that when an interviewer pressed the economy minister on the matter he abruptly ended the interview. But does this high inflation have a relationship with the size of Argentina’s public debt?
Surprisingly, inflation in post-crash Argentina hasn’t corresponded with higher debt levels; even when you factor in higher inflation after 2007 there is no relationship between debt levels and inflation rate:

(source)
Yet while Argentina’s inflation might not directly correspond with debt levels, there appears to be a connection between the fiscal and monetary policies of president Cristina Fernandez de Kirchner, including her management of the national debt. Perhaps most importantly, by using the central bank’s reserves to fund domestic spending, the government has removed an important guarantor of both currency stability and low inflation by removing the central bank’s independence.
At times, writing about these countries felt a little like writing Isaac Asimov’s A Choice of Catastrophes: is the world really this unforgiving when countries accumulate large debt? Judging by these three very different examples you might conclude that we are faced with three awful choices: crushing austerity (Spain), financial repression and deflation (Japan), or runaway inflation and dishonest institutions (Argentina). In truth, these are all extreme examples that I used to drive home a few points.
Firstly, if a country’s debt is not denominated in its own currency it runs the risk of defaulting on it’s loans, just like a private borrower runs the same risk. Conversely, it is difficult (perhaps impossible) for a country to default on its debt if it is denominated in its own currency. With this in mind, the risks of high levels of debt to a nation’s economy vary considerably depending on whether a county’s debt is denominated in its own currency or not. For countries with debt in a foreign currency, (the Euro counts in this case) the risk of actual default makes austerity much more likely and therefore the greatest risk of high debt levels comes from these possibilities. For countries with large debts denominated in their own currency the greatest threat to the economy stems from the effects of their own government’s actions directed at controlling the debt. This can come in the form of inflationary policies as in Argentina or in financial repression as Japan has employed.
So where does that leave the rest of us? What, for example, should the US do in response to it’s high levels of debt, currently exceeding Reinhart and Rogoff’s deadly 90% threshold? In reality, it’s not impossible for a nation to climb down from high levels of debt as long as a few things fall into place, if history is any guide:

Looking the above graph, one could imagine the extraordinary fiscal tightening that the US had to manage after World War II to eventually get debt levels from 120% of GDP in 1946 to just 31% in 1975. What might be surprising to some is that the United States almost never runs a budgetary surplus, even when debt levels have been very high:

(Source)
While there have been some periods of budgetary surplus, (eight in total before 1998) the overwhelming majority of the past 70 years has been spent in the red for the United States Treasury. How does this square with debt levels that remained low, or have fallen for long periods of time? The answer comes from a few factors that one might not consider at first when looking at government debt and spending (Krugman explains this in depth here). The two most important of these are the effects of economic growth and inflation on government debt. Say the government owe $1,000 in 10 years, and the average inflation for that period is a very acceptable 2.0%, and at the same time the economy grows at an average rate of 2.5% (the long term norm for the US economy). In ten years time, that debt would shrink by 45%, to a mere $550 relative to the rest of the economy. This is why during the 1990s the US debt to GDP level shrank even before the government ran a surplus:
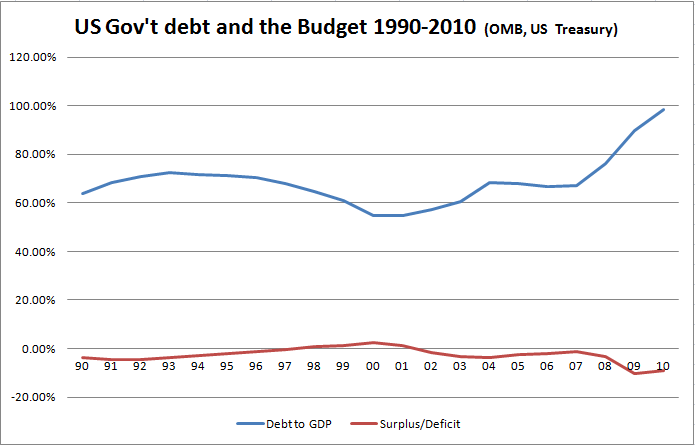
Essentially, if an economy can maintain average levels of growth, (say 2.5%) and average inflation (~2%) then government debt will decline as long as deficits do not exceed this combined total (in this case ~4.5%). This holds true in more than just the US case:
To summarize some points: high debt levels certainly have caused some serious problems for many economies, BUT these problems appear to be much more manageable when the debt issued is under a local currency. And while the high debt levels in the United States and other large economies might appear impossible to repay, equally large debts have been repaid in the past without default or high inflation being part of the outcome. I hope you enjoyed reading this blog as much as I enjoyed writing it, until next time.
